Common Questions and Misconceptions of Thermal Imaging for Detecting Energy Loss
We have had the opportunity to share the MyHEAT heat loss platform with many companies across North America and Europe over the last year. Almost universally, people love our platform and the powerful information that it communicates to energy consumers regarding the efficiency of their home. However, there are also many misconceptions about our aerial thermal imagery that we often address during these conversations.
Here are the common misconceptions and questions that we typically hear from potential partner organizations:

You are just doing a rooftop fly over – what can you really see?
It is a great question! The fact is, we can see a lot.
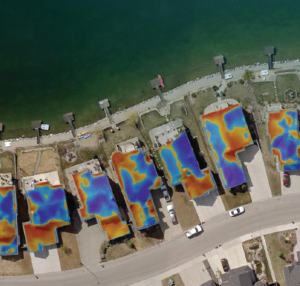
For instance, we can pick up the inefficiency of poorly insulated attics and walls, energy loss from windows, and air leaks around mechanical vents. We also work with energy advisors to investigate potential thermal and airtightness issues identified on our HEAT Maps. You can read more about this in a recent case study.
By offering a bird’s-eye view, MyHEAT can quickly and economically investigate energy waste across entire cities. In fact, a recent study found that each unit of our proprietary HEAT Ratings correlated to a 3 – 5% change in natural gas consumption. We can further combine our data with publicly available information (ex. building age, type, and value), as well as a client’s internal data to identify opportunities for efficiency improvements.

We’ve tried thermal imagery before and it didn’t work: how is MyHEAT different?
There have been competitors previously in the mass residential thermal imagery space. However, there are several factors that differentiate MyHEAT from these other service providers:
- Speed of Data Collection: We collect an entire large urban city in as little as 2 – 3 nights, compared to previous platforms that would require 2 – 3 months!
- Interactive Platform: Our platform, whether offered publicly or privately, enables users to interact with their personalized and easy-to-interpret home profile. This is where they can view their individual HEAT Map and HEAT Rating.
- Bird’s-Eye View: MyHEAT’s technology provides a complete overview of a buildings heat loss by identifying thermal bridging and other energy loss attributes. Additionally, most roofs are homogeneous compared to the front of a home with multiple materials (ex. doors, windows, and stone facades). This means fewer emissivity corrections and accurate corrections equals accurate data.
- Increase Rebate Program Participation: At MyHEAT, we offer partner organizations the opportunity to tailor the messaging on a user’s home profile, providing direct links to local energy efficiency programs and resources. Studies show that a homeowner that sees a thermal image of their home is 5X more likely to take energy-saving measures.
We like to tell our potential clients to think of MyHEAT as thermal imagery reimagined.

The data collected is an invasion of privacy – won’t homeowners be concerned?
The question of homeowner privacy comes up regularly. MyHEAT considers user privacy to be of utmost importance and we recognize the growing societal concerns around privacy in general. MyHEAT’s thermal images are very benign; nothing about our imagery suggests or shows anything with regards to occupants. In fact, there is more that someone could glean about occupants from the Google Maps image of a home.
When we first launched our public platform, we offered heat loss data for over 600,000 homes. Over two years we had only 12 homeowners ask that their homes be removed from the platform (which we do within 1 – 5 business days, no questions asked). Interestingly, MyHEAT had hundreds of homeowners outside of the initial data collection area contact us about having their home added to the map in that same period.

It is just aerial heat loss data – how does it actually motivate energy consumers?
Typically, our clients want to drive participation in energy efficiency rebate programs. We provide a direct link between users and local incentives, making it easy for customers to take the next step. Some of our recent projects have achieved clickthrough rates of up to 40%.
Additionally, results from a recent controlled study found that utility customers receiving MyHEAT’s data had a 28% higher participation rate in the local rebate programs when compared against customers in the control group. So yes, we have found measurable results!

It is easier to implement other behavioural programs – how does MyHEAT compare?
Our platform can be delivered in as little as three months, and significantly cheaper than other consumption comparison platforms. We fully develop a branded, interactive experience for your users and deliver a turnkey platform requiring very little work from your internal teams.
Additionally, a recent behavioural program found that our platform leads to higher savings than traditional consumption comparison messaging. Consumers viewing the MyHEAT platform achieved an energy savings that was nearly double the savings achieved by consumers viewing traditional consumption comparison messaging.
If you are looking for an innovative way to engage with your customers, we welcome the opportunity to connect with you! Feel free to contact us at hello@myheat.ca
Written by:
Ian Maddock, Co-Founder and VP of Revenue


