How to identify heat loss in your home – exploring rooftop hotspots
For a home or business owner, a bird’s-eye thermal image of their building can provide valuable insights into potential causes of energy loss. At MyHEAT, we continue to innovate our technology to provide the most accurate visual representation of energy loss for our users. We partner with utility providers and government agencies to provide personalized visualizations to energy consumers in an effort to boost efficiency program participation and motivate users to take energy-saving action.
As part of each user’s Home Profile, MyHEAT generates a personalized HEAT Map and HEAT Rating for buildings. For more information on each of these components, read our article on infrared heat loss maps.
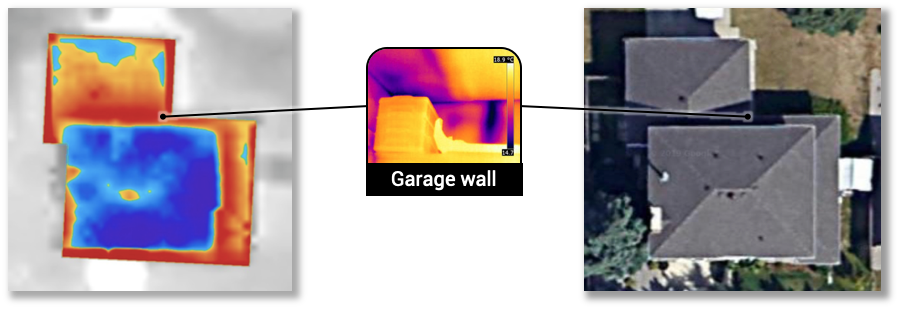
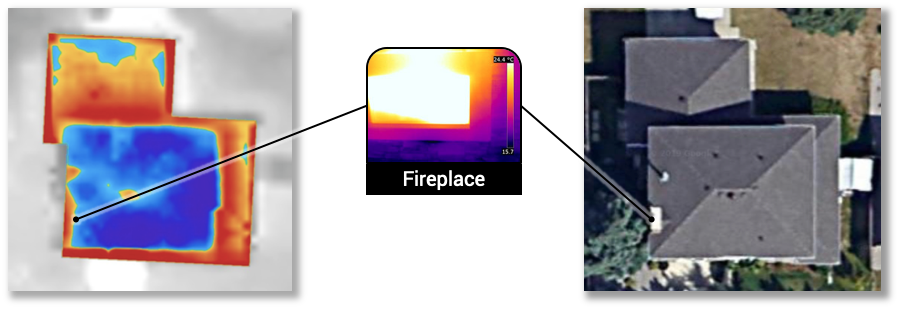
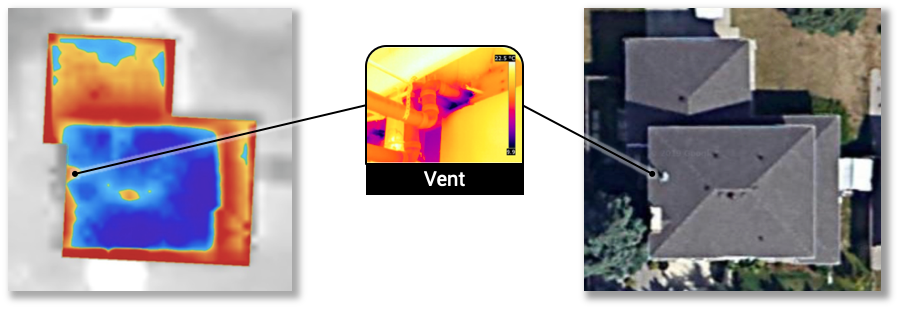
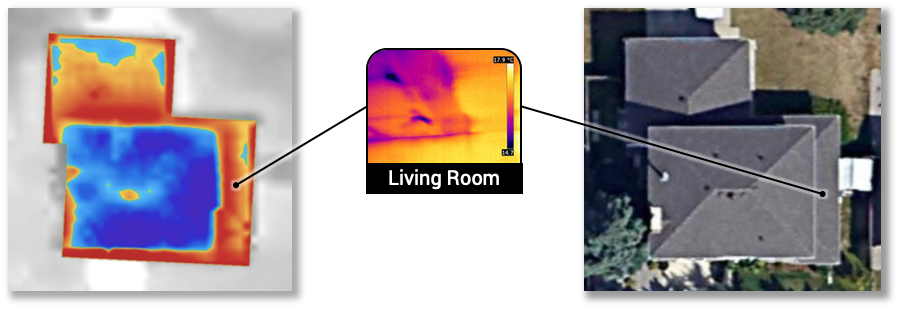
HEAT Maps, shown below, display potential heat loss areas in a building from a bird’s-eye view. In this image, red indicates areas with higher heat loss measured and blue indicates lower heat loss. Each building shows the full spectrum of colours, assigning red to the hottest areas and blue to the coolest.

How can heat maps help identify and address heat loss in buildings?
HEAT Maps are visualizations of heat loss that are intended to be used as an indicator of a potential problem, not a diagnosis. This information can be used to identify areas in a building envelope which a home or business owner should investigate and consider upgrading. We connect users to information on incentive programs and local energy advisors to help them get started.
Investigating common heat loss areas in buildings
We regularly partner with a local energy advisor to investigate and compare HEAT Map images with in-home energy evaluation results for existing homes in an effort to track and improve the accuracy of our technology.
In a recent case study, we found several consistent findings between the MyHEAT imagery and the on-site evaluation of 5 homes. Key takeaways included:
- In all cases, the investigation revealed potential thermal and air tightness issues that correlated to warm areas in HEAT Maps. Poorly sealed attic hatches, plumbing stacks, and poorly sealed mechanical chases all appear to match locations on the HEAT Map.
- On the least energy efficient homes, the HEAT Map provided the most relevant information.
- Homes with the original attic insulation were more likely to have no other improvements or upgrades. Since attic insulation is one of the least costly upgrades, it is often completed before other improvements such as windows, or furnaces.
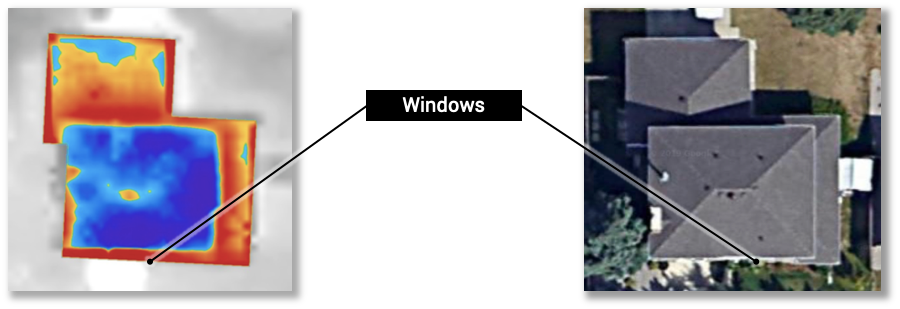
Using the HEAT Map above for one of the homes included in the case study, we will walk through how to interpret the information and what insights can be gained from the MyHEAT platform by investigating hotspots throughout your home or business.
1. Garage walls
2. Fireplaces
3. Mechanical Vents
4. Insulation
5. Windows
How to prevent and reduce home heat loss
Once users have taken some time to familiarize themselves with their HEAT Map, they can start to identify correlations between hotspots and the areas in their home where they’ve felt drafts during colder months. Recognizing these patterns is a significant step towards understanding how to prevent heat loss in a house, ultimately leading to improved energy efficiency and increased comfort levels throughout the year. Our platform connects users with efficiency resources, local incentive programs, and energy advisors to help them take the next steps towards savings and reduce energy waste at home.
Having a visual tool for building owners to identify energy loss as an investigative first step proves to be valuable when the goal is to drive efficiency program participation. The MyHEAT platform helps to target, engage, and motivate hard-to-reach consumers with personalized and comparable energy data in order to capture more savings.
Want to offer the MyHEAT platform to energy consumers in your area? Visit myheat.ca or contact MyHEAT at solutions@myheat.ca to learn more.
Written by:
Chelsea Froklage, Marketing & Design Lead


